Propaganda images reveal how terrorists think

Researchers have used artificial intelligence to analyse over 30,000 propaganda images produced by the Islamic State (IS) between 2014 and 2022. 

A group of IS soldiers with weapon and an IS flag.
From Diyala, Iraq, in the spring of 2022: a group of IS soldiers swears Bay’ah – an oath of allegiance to the new IS caliph. This is one of the 30,000 IS images that have now been analysed. 

Propaganda is an important part of the operation of a terrorist organisation. They use text, video, audio, and images to not only spread fear, but also to recruit and build their image internationally. By using the internet and social media, even terrorist groups with limited resources can reach a global audience.

For researchers studying terrorist groups, propaganda material is an important source in understanding who the actors are, what they want, and how they operate. The challenge for researchers is the sheer amount of propaganda that is being produced, which makes it almost impossible to get an overview through manual means. 

Because IS controlled a large area in Syria and Iraq for several years, they gained more resources and more members who could work as ‘journalists’ or content producers. Propaganda was clearly a prioritised area in the organisation, and the battles they were involved in provided them with plenty of raw material. 

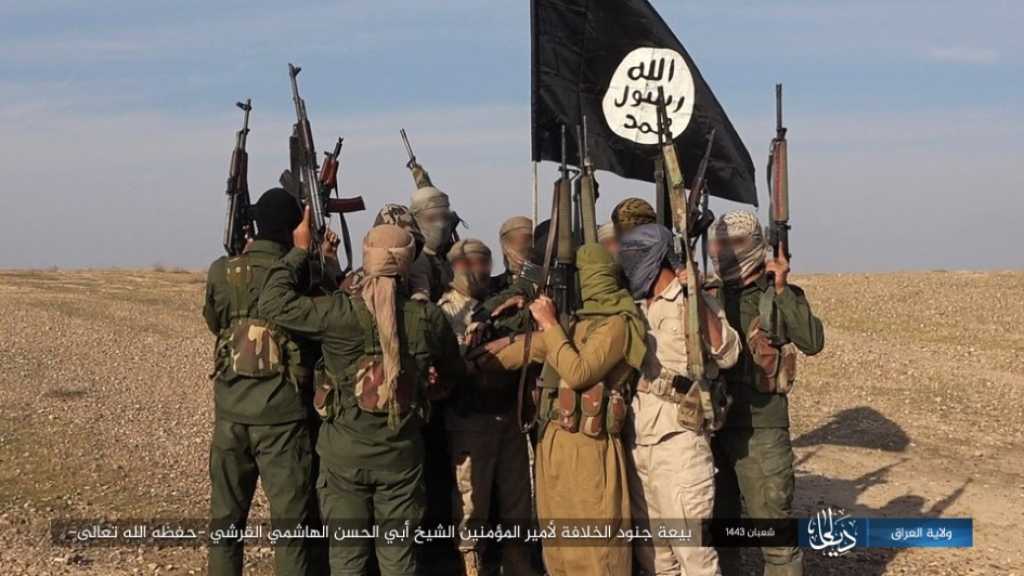
‘IS stood out because their propaganda was better than the content of earlier terrorist groups. They managed to create a “brand” and a linguistic and visual expression that appealed to the youth, combined with extremely brutal content where close-ups of killings were almost a given,’ explains Skretting. 

Although the group is now marginalised in its original core areas in Syria and Iraq, its branches in other parts of the world have made significant progress – especially in Africa. IS still maintains a unified and substantial propaganda apparatus. 

IS – a pioneer in terrorist propaganda 

The researchers have based their work on the extensive image material published on IS’s official channels over the years. The dataset, consisting of 30,000 images, was fetched from an IS bot on Telegram. 

‘IS has revolutionised how non-state actors and terrorist groups conduct propaganda. This is considered one of the keys to the group’s success,’ says researcher Vidar Skretting. He co-authored the report with colleagues and AI researchers Mathias Bynke and Bernt Ivar Nødland.

The rise and fall of IS 

In 2013, a group called the Islamic State in Iraq and the Levant (ISIL), managed to occupy large parts of Syria and Iraq. In 2014, they seized Mosul, Iraq’s second-largest city. Shortly thereafter, ISIL declared that they had established a new caliphate, to which all Muslims were obliged to submit. At the same time, they removed the geographical reference from their name and adopted ‘the Islamic State’ as their designation, or IS for short. 

From 2014 to 2018, IS gained international notoriety for its brutal conduct. They implemented a reactionary form of Islamic law and carried out executions and amputations of prisoners, genocides against minorities, public slave trading, and numerous terrorist attacks on civilian targets in the Middle East, Asia, Africa, and Europe. 

At the same time, they wanted to show that they had established a true Islamic ‘state’. The group emphasised creating a civil state apparatus and established institutions for law and order, tax collection, education, and healthcare. In addition to violence and brutality, the ‘civil’ side of IS became a recurring theme in the group’s propaganda production. 

IS reached its territorial peak in 2015, when the group controlled about one-third of both Iraq and Syria. After this, IS was gradually pushed back by an international coalition. The last IS-controlled area was captured by Kurdish forces in early 2019. Thus, IS went from being a state-like entity back to an underground organisation.

A dedicated IS social media 

Initially, IS used established social media platforms like Twitter (X), Facebook, YouTube, and, later, the Telegram app to spread their content. 

‘The spread of propaganda on social media is one of the reasons so many foreign fighters from around the world joined IS,’ says Skretting. 

‘Today, it’s much more difficult for IS to reach out. Major social media platforms remove such content almost immediately after it’s posted. However, IS still manages to disseminate its content effectively through other channels, and it’s relatively easy for sympathisers to find them,’ Skretting adds. 

IS spreads its propaganda through three main channels: ‘private’ social media platforms that they run on their own servers, bots on Telegram, and regular indexed websites. 

‘The private social media platforms IS runs have been active for years. Telegram bots and the indexed websites are regularly taken down by administrators and authorities but are usually reopened by IS under different names shortly thereafter,’ says Skretting. 

Two researchers present at an FFI event.
Mathias Bynke (to the left) and Vidar Skretting (to the right) present their report during an FFI event on 12th of December 2023. Photo: FFI / Anders Halvorsen Fehn.

Sorting 30,000 images 

In their work, the researchers used a machine learning model from OpenAI called Contrastive Language-Image Pre-training (CLIP). The model is trained to compare images with text. 

CLIP has been trained by collecting enormous amounts of images and corresponding captions from the web. By comparing millions of images and captions, the model has gradually learned how images can be described in words and, conversely, how an image might look based on the text describing it. 

By running the 30,000 images through CLIP, the researchers could, for example, ask the model to find all images showing a ‘person praying’ or ‘combat action.’ However, instead of manually defining the categories in which the images should be sorted, the researchers used a clustering algorithm to group the images by theme. 

‘We didn’t know in advance which descriptions would suit various themes. When you provide the CLIP model with a limited number of categories, an image of a man diving into a river could easily end up in the category “image of someone praying”,’ explains Mathias Bynke.

Illustration of the Clip model.
The Clip model.

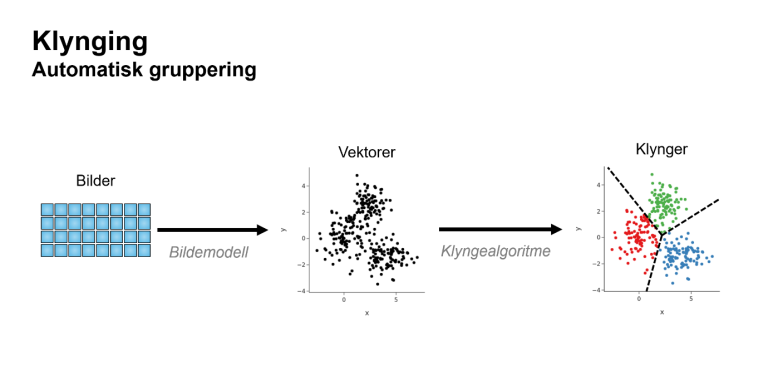
The CLIP model translates an image into an embedding vector, that is, a sequence of numbers. It also translates the image captions into a sequence of numbers. If you have an image of apples, the number sequence for the image should be approximately the same as the number sequence for the text ‘image of apples.’ 

The number sequence that CLIP generates for each image can be converted into coordinates in a coordinate system. This gives each image a position on a map. Then, an algorithm can cluster these points into groups. You can choose how many clusters you want, and the algorithm organises the images for you. 

When the researchers asked the algorithm to create two clusters, one group was dominated by military images, and the other by civilian images. 

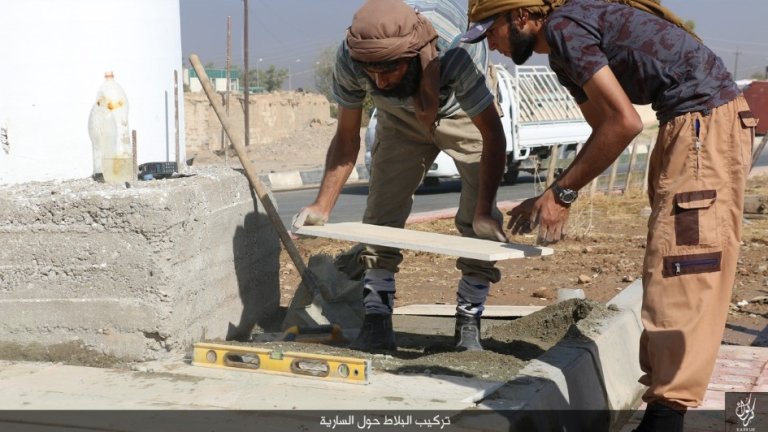
In the end, they settled on 14 different named clusters: combat scenes, soldiers outside combat, enemy bodies, executions and killings, close-ups of individual fighters, weapons, civilian crowds, peaceful scenes, collapsed buildings, civilian casualties, food, public works, crafts and industrial production, and burning cigarette packets.

What have we learnt about IS from the images? 

Once the images were sorted, the researchers wanted to answer the following question: How has IS’s image propaganda evolved from 2014 to 2022, and what does this development tell us about IS as a group? 

‘The images IS publishes, the number of images published, and where they are published give us an indication of what IS is doing, how active they are, and in which areas they’re active,’ says Skretting. 

He believes that insight into the development of terrorist organisations can be important in predicting their direction and strategies: By looking at the images from the African provinces where IS is on the rise, we might gain insight into where IS is heading in the future. 

The analysis shows that in the early years (2014–2018), IS presented itself as both a military organisation and a civil state apparatus. This is linked to their attempt to build a ‘real’ Islamic state. 

Since 2019, the focus has shifted. IS now presents itself almost exclusively as a military movement and insurgent group. 

Two men working.
An example of one of the ‘civil’ images of IS’s Iraq and Syria branch, in the ‘public works’ cluster.

2015 was the year IS was most active in terms of propaganda. Nearly half of all the images in the dataset are from this year, which coincides with the time when IS was at the height of its power in Syria and Iraq. Thus, most of the images in the material are from Syria and Iraq. 

‘The group has been defeated in their previous primary areas but is rebuilding in Africa. We also see this trend in the image material,’ says Skretting. 

Activity was at a low point in 2020 but has since increased. The majority of images are now published in West and Central Africa. These differ from those produced in the Middle East in several ways. 

‘There is much less focus on individual jihadists and martyrs. At the same time, the propaganda images are generally more brutal. They’re dominated by military content, reflecting the fact that they are most active as a military organisation,’ says Skretting. 

Further development of the methods is needed 

The researchers conclude that the combination of CLIP and clustering algorithms is an effective method for quickly analysing large amounts of propaganda images. 

‘The division into clusters was not perfect. A certain proportion of the images appeared misclassified, and we had to implement mechanisms to filter these out. But the method helps to speed up the analysis,’ says Skretting. 

He emphasises that the combination of CLIP and clustering algorithms can be used for more than analysing terrorist images. 

‘The method is relatively simple and scalable. You can easily use it to sort image collections far larger than 30,000 images into thematic clusters. The method is particularly useful if you don’t know a lot about the content of the image material in advance.’ 

The researchers believe we should further develop machine learning methods to map propaganda from state and non-state actors. 

‘This type of method is not only relevant for image analysis but also for getting an overview of large text, audio, and video materials,’ stresses Mathias Bynke. 

FFI-Report 2025

Evaluering av anskaffelsen av artillerisystemet K9 VIDAR – P5447 Artillerisystem 155 mm

Procuring new artillery to replace the ageing M109 system has been a long-running process. The process began in the early 2000s with a project to exchange Dutch Panzerhaubitze 2000 systems for Norwegian air defence systems. This agreement was cancelled and replaced by a development project with Sweden to develop the wheeled Archer artillery system. That agreement was eventually cancelled as well, leading to the acquisition of the K9 Versatile Indirect Artillery System (VIDAR) from South Korean Hanwha Systems. In this report, we have evaluated the project using the Concept program’s model for assessing major public procurements that have undergone external quality assurance. This is a well-established method with six evaluation criteria, which at the time of evaluation had been used to assess over 40 major public procurement projects. The six criteria are productivity, goal achievement, other effects, relevance, viability, and economic efficiency. The contract with Hanwha was signed in 2017, and the artillery systems were delivered to the Army in 2020. As part of the project, a smaller quantity of ammunition, including precision ammunition, was also to be procured. This part of the project has not been delivered on time, and its scope has also changed. As of today, the ammunition delivery has not been completed. Project P5447 has delivered new artillery systems to the Army within budget and on time. The quality of the systems is also in line with the project’s governing documents. Regarding the achievement of the project’s effect goals, the evaluation shows that most of them have been met. However, the third effect goal – related to the cost of maintaining an artillery capability –has not been achieved. The evaluation has not identified any significant other effects from the project’s implementation. No negative effects have been found, while the positive effects identified will to some extent depend on the Defence Materiel Agency’s ability to learn from this project. These effects are therefore somewhat uncertain. The relevance of the project appears to be just as strong as it was at the time of the investment decision. The war in Ukraine has demonstrated how artillery can inflict losses on the enemy and remains a relevant capacity in a modern army structure. However, the war in Ukraine has also revealed weaknesses in these types of systems and highlighted the relevance of drones in modern warfare. The system’s viability is good, but the evaluation has also identified certain factors that may raise questions about whether it will be possible to maintain the system’s operation at an acceptable level throughout its lifespan. In conclusion, the evaluation shows that the project appears to be a socio-economically sound investment.
FFI-Report 2025

Status og utsikt for Ukrainas økonomi – våren 2025

This report provides a basic introduction to and assessment of how Ukraine’s economy has been affected by being at war. To understand its development, we will examine trends dating back to 2010 – that is, before the annexation of the Crimean Peninsula and the war in Eastern Ukraine – and the outlook for the Ukrainian economy through to 2030. Between 2010 and Russia’s full-scale invasion in 2022, Ukraine’s economy was characterized by transition and several economic shocks. In the early part of the decade, the economy was on a path to recovery in the aftermath of the global financial and credit crisis. However, Ukraine still faced major challenges in its transition to a market economy, including weak institutions and widespread corruption. The economy was later hit by three major setbacks: first in 2014/2015 with the annexation of Crimea and the war in Donbas (-15 percent), then during the COVID-19 pandemic (-4 percent), and finally the sharp decline following Russia’s full-scale invasion (-29 percent). Throughout this period, the government implemented several reforms, particularly in monetary policy, to adapt and strengthen the economy. However, Ukraine continues to struggle with a large informal economy even after the full-scale invasion, partly because many workers avoid official registration out of fear of being mobilized for the war. The state budget has increased significantly to finance the defence effort against Russia – its share of GDP rose from 30 to 60 percent between 2021 and 2024. Adjusted for inflation, the defence budget grew twelvefold during the same period. In 2024, defence and security expenditures accounted for over 60 percent of consolidated public spending. This sharp increase has been made possible due to financial support from other countries, a substantial rise in national debt, money printing, and tax increases. In addition, Ukraine has received large quantities of military equipment from abroad, which economically has been equivalent to the country’s annual defence budgets. Even after the war eventually ends, Ukraine will remain dependent on international economic support for a long time due to the high costs associated with reconstruction and economic transformation. The economic outlook is particularly influenced by the course of the war, emigration and labour force availability, energy supply, and the ability to maintain exports – especially of agricultural products. Nevertheless, there is significant potential for growth beyond current forecasts, especially depending on three key factors: the return of Ukrainian refugees after the war, a reduction in the informal economy, and more efficient energy use in industry and households.
FFI-Report 2025

Forsvarssektorens miljø- og klimaregnskap for 2024

The reports in the series “Environmental reporting in the Norwegian defence sector” are published annually by the Norwegian Defence Research Establishment (FFI). These present data reported by the defence sector and associated partners to the Norwegian Defence Environmental Database (NDED). The reports provide an overview of results and trends for environmental aspects of the defence sector’s operations, including waste production, energy expenditure, fuel consumption, use of ammunition, water consumption, consumption of chemicals and acute pollution. Greenhouse gas emissions are presented in a greenhouse gas inventory. Waste generation is reported to the NDED by associated waste management companies contracted within the various regions of the Norwegian Defence Estate Agency (NDEA). The total amount of waste produced in 2024 was 16 961 tons, which represents a 9 % increase compared to 2023. The degree of waste sorting was 65,1 %, an increase of 1,9 percentage points compared to the previous year. 33.3 % of the waste was recycled, while 59.8 % was processed with energy recovery. Energy consumption associated with the defence sector’s buildings and properties in Norway is reported by the NDEA through statistics from suppliers. The total energy consumption in buildings and other properties is estimated to 702.9 GWh in 2024. This represents a 7.3 % decrease compared to 2023. Of the energy used in 2024, 94 % came from renewable sources, which is about the same as the previous year. Fuel consumption connected to the use of vehicles, aircraft, vessels and auxiliary power units was 97 708 m3 in 2024. This is an increase by approximately 7.8 % compared to 2023. Fuel consumption on aircraft and vessels represents 91.6 % of the total fuel consumption in the defence sector. The use of ammunition is reported and specified on a digital form (DBL-750) by organizational unit, shooting range and ammunition type. A total of 20 499 627 units of ammunition were reported used in 2024, which is 18% more than in 2023. The degree of reporting is the relationship between ammunition provided to the Armed Forces and the proportion reported being used. The degree of reporting in 2024 was 85 % (excluding blank ammunition), which is an increase of 11 percentage point compared to 2023. The reported use of lead-based small arms ammunition has increased with 368 000 units, or 38 %, from 2023 to 2024. The estimated emission of lead is 6.1 tons in 2024, compared to 4.5 tons in 2023, an increase of 36 %. Water consumption is reported by the NDEA based on measured and estimated volumes. The total water consumption in 2024 was 2.17 million m3, a reduction of 5 % compared to 2023. The use of chemicals is reported from establishments within the sector where chemicals are used on a regular basis. However, with the exception of de-icing fluids, it is insufficiently reported. 23 727 kg of aircraft deicing, and 423 600 kg of runway deicing fluids were reported in 2024. The relative usage of urea to the total usage of runway deicing fluids was 62 % in 2024, a decrease of 18 percentage points compared to 2023. The greenhouse gas inventory consists of reported fuel and energy use and emission factors associated with the various materials. Emissions from the defence sector’s activities were estimated to 259 816 tons of CO2-equivalents in 2024 (scope 1 and 2), and 1 441 932 tons of CO2-equivalents when including indirect emissions not mandatory to reporting (scope 3). Emissions in scope 1 and 2 have increased by 6 % compared to 2023. There is a close relation between the demands and prerequisites which dictate the sector’s volume and pattern of activity and its total impact on the environment. It is therefore relevant to assess this impact in light of the tasks assigned to the defence sector within a dynamic political framework.
FFI-Report 2025

Offensive cyberkapabiliteter og strategisk kultur i utvalgte NATO-land – en analyse av strategi- og policydokumenter

This report examines how selected states portray offensive cyber capabilities. To explore this topic, we have chosen a twofold approach. In the first part, we examine how states describe their ability to conduct offensive cyber operations in their own strategy and policy papers. This approach may contribute to a better understanding of variations in approaches to cyber operations among states. The states selected for the first section of this report are the United States, Canada, the United Kingdom, France, the Netherlands, Germany, Denmark, Sweden, Finland, and Estonia. The US and the UK are included due to their influential roles in the field's development, while Denmark, Sweden, Finland, and Estonia provide a Nordic and a small-state perspective. The US, UK, and France adopt a more explicit offensive approach in depicting their own policy towards offensive cyber operations. The Netherlands, Denmark, Sweden, Finland, and Canada emphasise portraying offensive cyber capabilities within a defensive framework. Estonia and Germany are more reserved in explicitly referring to offensive cyber operations but still emphasise the role of cyber capabilities within a national security framework. In the second part of the report, we explore why states have developed varying approaches to their offensive cyber capabilities and strategies. This analysis examines their policy and strategy documents through the lens of strategic culture. Strategic culture shapes ideas about acceptable behaviour in security and defence, influencing how states perceive what appropriate use of offensive cyber operations is. The second part focuses on three states: the United States, Germany, and Denmark. Drawing on existing literature, we establish categories for the strategic culture of each state. We find that the United States and Denmark consider it legitimate to use offensive cyber operations as a means of power beyond their borders and against other states. This approach reflects their strategic culture. By contrast, Germany has a strategy to offensive cyber operations that emphasises its security and non-military threats, especially threats by criminal actors. We find that this approach also reflects Germany’s strategic culture.
FFI-Report 2025

Kostnadsrisiko på porteføljenivå – muligheter for aggregering av kostnads- og usikkerhetsanalyser fra investeringsprosjekter

Defence acquisitions are associated with significant cost risk. Projects often have cost escalations well beyond their initial point estimates. In recognition of this uncertainty, it has become common practice to express cost estimates as a probability distribution where a range of possible cost outcomes has probabilities assigned to them. The spread in these cost outcomes is what we typically call the cost risk. When cost risk materializes as cost escalations, it can have large negative impacts on defence capabilities. Cost escalation in one or several acquisition projects will, under budget constraints, lead to delay, downscaling, budget rebalancing, and, in the worst-case, cancellation of projects – all of which can negatively impact defence capabilities. To reduce the negative impacts that cost risks may have, it follows that cost risk in a portfolio must be managed well. Defence portfolio risk is not estimated or analysed in the Norwegian defence sector. We propose ways to estimate the cost risk and methods to analyse it. We apply the methods on a selection of Norwegian defence acquisition projects. Using cost and uncertainty analyses from acquisitions projects, we construct a mini portfolio for which we calculate cost risk, decompose cost risk, and describe drivers of risk. Our methods illustrate how cost risk may be made visible at a portfolio level and how analyses of the cost risk may help portfolio managers govern risk and uncertainty. We also discuss limitations in our methods, specifically due to unknown data quality, ignoring the time dimension, and unknown covariance between project risk. To alleviate these limitations, we make four suggestions that are within portfolio managers’ scope to act on: 1. Covariance should be estimated. 2. Risk should be phased over time. 3. Cost estimates should be made more accessible. 4. The quality of the uncertainty analyses should be asserted.
FFI-Report 2025

Mobbing og seksuell trakassering i Forsvaret, i FMA og ved FFI – resultater fra en spørreundersøkelse i 2024

In this report, we present the results of a survey on bullying and sexual harassment in the Armed Forces, in the Norwegian Defence Materiel Agency (NDMA), and at the Norwegian Defence Research Establishment (FFI) conducted in December 2024. This is the fourth time such a survey has been conducted in the Armed Forces, and the second time it has been conducted in NDMA and at FFI. The survey indicates the prevalence of bullying and sexual harassment in 2024, as well as awareness and trust in the reporting system. The results show that gender and age affect the likelihood of experiencing both bullying and sexual harassment in the defense sector. Young people, especially young women, are more likely to experience bullying and sexual harassment. Because gender and age affect the likelihood of experiencing bullying and sexual harassment, we divide the respondents into different groups in our analyses: conscripts/students, young employees (30 years and younger), and older employees (over 30 years). In the Armed Forces, bullying was most prevalent among conscripts/students, where 25 percent of women and 17 percent of men had experienced bullying in the last six months. Among young employees, the proportion was 17 percent for women and 11 percent for men. The proportion among female employees older than 30 was 8 percent in the Armed Forces and 7 percent in the FMA. Among male employees over 30 years, 6 percent in the Armed Forces and 4 percent in FMA had experienced bullying. At FFI, bullying was generally less prevalent, with only 3 percent of employees reporting such experiences. When it comes to sexual harassment, approximately 50 percent of female conscripts/students and young female employees in the Armed Forces and FMA had such experiences it in the last 12 months. Among male conscripts/students and young employees, the prevalence was 12–14 percent. The prevalence among women over 30 years was 24 percent in the Armed Forces and 19 percent in FMA, while for men it was around 8 percent in both organizations. At FFI, sexual harassment was generally less prevalent, with only 6 percent reporting such experiences. Slightly more people knew how to report in 2024 than in 2022, but many were unsure about which incidents to report. The proportion of people reporting was almost unchanged from 2022 to 2024. The main reasons respondents did not report were that they did not want to proceed with the incident, that they were unsure if the incident was serious enough, and that they did not believe the report would lead to any action. The results of the survey show that the level of bullying and sexual harassment has remained roughly unchanged since 2022 in all three organizations, although sexual harassment among conscripts/students and young female employees in the Armed Forces has decreased. The prevalence is still high in certain groups, however, and we recommend that the defense sector strengthens its efforts to prevent and combat bullying and sexual harassment.